
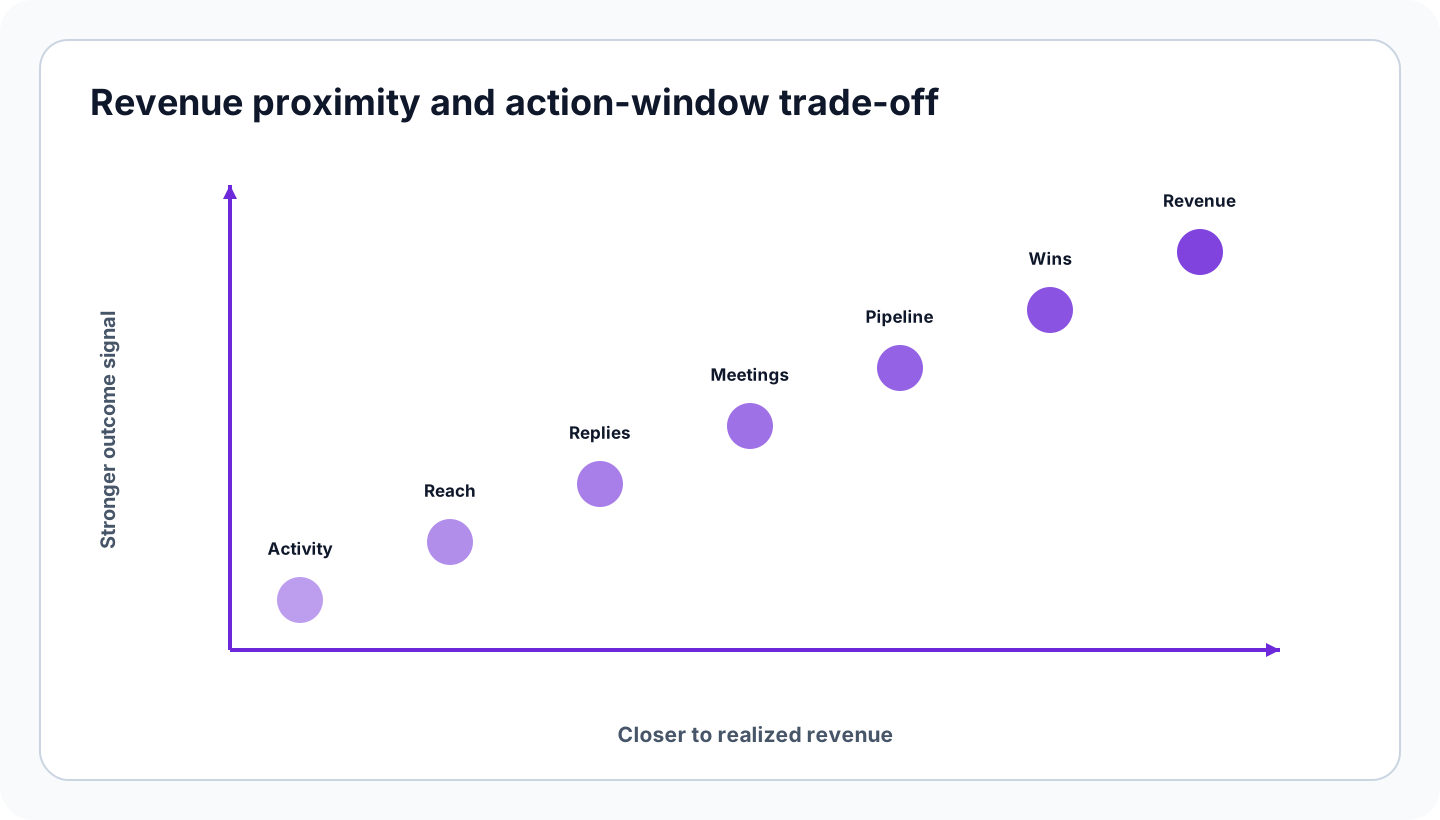
The closer a metric sits to realized revenue, the stronger its outcome signal and the less time it leaves for correction.

How the revenue-distance ranking works
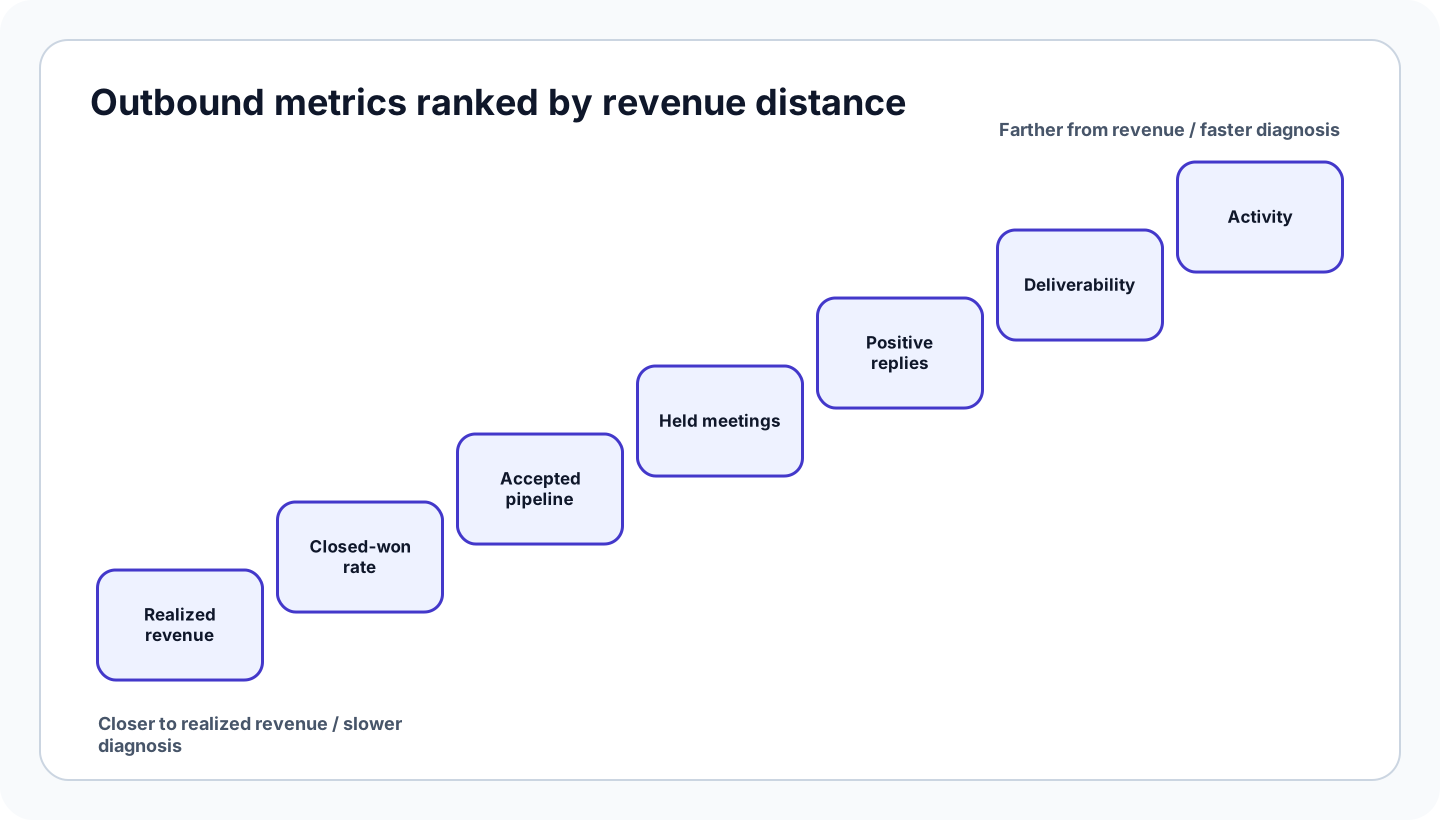
The ranking uses two tests. First, count how many material decisions and conversion events stand between the metric and realized revenue. A delivered email must still reach the right person, produce a meaningful response, create a held conversation, survive qualification, become accepted pipeline, progress, close, and be recognized as revenue. An accepted opportunity has fewer remaining steps. Second, ask how much time the metric leaves an owner to change the outcome. Farther metrics are noisier outcome signals, yet they may expose a broken list or message while a cohort is still active. Closer metrics are more commercially meaningful, yet a quarterly revenue result may arrive after the campaign, staffing plan, and territory design can be repaired. This is a causal-distance ranking, not a claim that one number is universally best. Data definitions, attribution policy, cohort maturity, sales cycle, source mix, and downstream execution can reorder the usefulness of a metric for a specific decision.
Count causal steps, not dashboard position
A dashboard layout can place activity beside revenue without making them equally informative. Write the chain between each measure and revenue, including buyer decisions, seller decisions, qualification, acceptance, and close. A metric moves closer only when the remaining steps are fewer and materially defined, not because leadership reviews it more often.
Add the action-window test
For every measure, record the owner, review frequency, and latest moment at which an intervention could change the cohort. Deliverability may be checked during launch; held-meeting quality may be reviewed weekly; closed-won revenue may shape the next planning cycle. A late metric can govern strategy while remaining unsuitable for daily diagnosis.
Realized outbound revenue
Realized revenue attributable under the organization's accounting and attribution rules ranks closest because it is the commercial result rather than a proxy. It still needs boundaries: define which source or motion receives credit, how multi-touch and partner influence are handled, when revenue is recognized, which cohort created the opportunity, and whether renewals or expansions belong in the same measure. Revenue is strong for portfolio and investment review but weak for diagnosing today's list, sender configuration, or message. A decline may reflect upstream targeting, downstream discovery, product fit, pricing, procurement, implementation risk, or a change in sales-cycle timing. The metric says the outcome changed; it does not identify the mechanism. Use it to govern the system and to select cohorts for reconstruction, not to tell an SDR which line of an email to rewrite this afternoon.
Formula: outbound-attributed realized revenue is recognized revenue assigned to the defined outbound cohort under a documented attribution rule. The formula is incomplete until the team states the assignment rule, recognition window, exclusions, and treatment of shared influence.
Closed-won rate for outbound opportunities
Closed-won rate ranks one step farther because it measures the disposition of opportunities rather than the amount and timing of realized revenue. Define it as closed-won outbound opportunities divided by all outbound opportunities closed in the same mature cohort. Do not divide wins by currently open pipeline, and do not compare cohorts before enough time has passed for representative outcomes. The measure is useful for examining whether accepted opportunities convert, but it blends pipeline quality with account-executive execution and market conditions. Segment by source, market, product, deal band, and acceptance-rule version before attributing movement to outbound work.
OKKI Go may support earlier research and human-confirmed outreach steps, but its documented workflow is not evidence of a closed-won effect. The measurable input is a reviewed search and outreach record; the output is a traceable attempt and status; the human confirms selection and send; downstream wins remain subject to qualification and sales execution.
Accepted outbound pipeline
Accepted outbound pipeline ranks below closed-won rate because value and qualification remain exposed to progression, loss, slippage, and forecast error. It is nevertheless the closest early commercial signal controlled jointly by sales development and the receiving sales team. Count opportunities only after a receiving owner accepts the account reason, problem evidence, open questions, next action, and ownership. Gross value entered before review is not comparable pipeline. Useful measures include accepted opportunities, accepted value under a consistent amount policy, acceptance rate, return reasons, and time to acceptance. Keep created pipeline separate from forecast and realized revenue.
Formula: handoff acceptance rate is accepted outbound opportunities divided by proposed outbound handoffs in the same cohort and rule version. A rising rate can reflect stronger qualification, a looser acceptance rule, or a different account mix, so inspect return codes and downstream progression before declaring improvement.
Held meetings and meeting-to-opportunity conversion
Held meetings rank farther away because attendance does not establish a commercial problem, fit, or accepted next step. Prefer held meetings to booked meetings: scheduling can be inflated by duplicates, cancellations, weak contact relevance, or calendar policy. Then pair the count with meeting-to-accepted-opportunity conversion and coded outcomes. Define the denominator as held first meetings from a mature outbound cohort; exclude reschedules and internal meetings according to a written rule. A low conversion rate may indicate targeting, message expectation, contact role, discovery quality, or an acceptance boundary. The metric directs review to a stage but cannot identify the cause alone.
Meeting show rate is held meetings divided by meetings scheduled for the same cohort. Review the timing and cancellation policy before comparing teams. A higher show rate is operationally useful, yet it remains several decisions from revenue and should not override evidence that the resulting conversations fail qualification.
Positive replies and qualified conversations
Positive replies and qualified conversations provide early evidence that the account, person, timing, and message may deserve more work. They rank below meetings because intent expressed in a reply still requires interpretation and may not result in a held conversation. Define reply categories before launch: positive interest, relevant objection, referral, timing signal, explicit no, unsubscribe, automated response, and unrelated response. A useful reply can improve the system even when it disqualifies the account, because it changes the next decision. Open rate should not substitute for reply quality; tracking and privacy changes, automated loads, and recipient behavior weaken its decision value.
In a bounded OKKI Go workflow, the input can be a reviewed account hypothesis, the documented output a prepared draft and visible send status, the human confirmation the final selection and send decision, and the usable result a traceable outreach record. Reply classification and pipeline impact still need team-owned rules and verification.
Keep the denominator reconstructable
Reply rate should identify whether the denominator is sent, delivered, or right-party delivered messages. Preserve suppression, bounce, duplicate, and automated-response treatment. Without those choices, two teams can report the same rate from different underlying events and take incompatible actions from the comparison.
Separate a reply from buyer progress
A polite response, referral, objection, and confirmed project signal all carry different decision value. Code the response and record what changed: contact route, timing, problem evidence, stakeholder map, or stop condition. The metric becomes useful when an owner can explain the next action rather than merely count sentiment.
Deliverability and right-party reach
Deliverability and right-party reach sit far from revenue but close to an important mechanical threshold because the intended audience had a plausible opportunity to receive and recognize the outreach. Track delivery failures, bounce categories, suppression, spam or provider signals where lawfully available, and the fraction of attempts reaching the intended role. Do not interpret successful delivery as engagement. A delivered message can be irrelevant; a bounced message cannot test the message at all. Audit data provenance and contact freshness before rewriting copy in response to weak replies. Channel rules also vary by jurisdiction, recipient type, personal-data use, transparency, and objection handling. The UK ICO guidance is one jurisdictional example, not global legal advice.
OKKI Go's candidate review, route correction, contact discovery, draft preparation, user confirmation, and visible status can preserve checkpoints for an outreach audit. The human must still verify market settings, contact relevance, restrictions, and the interpretation of status; documented workflow does not establish inbox placement or revenue causality.
Activity volume and cadence completion
Activity volume and cadence completion rank farthest because they record seller execution without showing recipient relevance, buyer progress, accepted pipeline, or revenue. They remain useful for capacity, adoption, and instrumentation questions. Dials per day, messages sent, accounts researched, tasks completed, and cadence completion can reveal whether a defined motion was executed. They cannot demonstrate that the motion was well designed. Compare activity only within compatible roles, channels, account complexity, work definitions, and observation windows. The Bridge Group publishes activity and pipeline measures from an observational B2B sample; its market mix and methodology make the figures context rather than universal quotas.
Use activity as the bottom layer of a diagnostic stack. If revenue changes, move backward through closed outcomes, accepted pipeline, held conversations, replies, reach, and finally execution. If activity changes first, move forward and test whether the same cohort produces stronger evidence at each boundary. The correct dashboard preserves both directions without letting the easiest count become the governing outcome.
Start with the decision, then choose the nearest metric that arrives in time to change it. Preserve one closer outcome signal and one or two farther diagnostic signals for each operating question. Remove any dashboard number whose denominator, owner, cohort, and action window cannot be stated. A smaller measurement system often produces better decisions because every remaining number has a defined job.
Frequently asked questions
What are the most important outbound sales metrics?
Use a stack rather than one measure: realized outbound revenue, closed-won rate, accepted pipeline, held meetings and conversion, qualified replies, deliverability and right-party reach, and activity. Their importance depends on the decision. Closer measures govern outcomes; farther measures diagnose the system while there is still time to act.
Why rank outbound metrics by distance from revenue?
Distance makes the proxy chain visible. A metric several decisions away from revenue should not be presented as an outcome, while a revenue metric should not be expected to diagnose today's campaign mechanics. Ranking also exposes the trade-off between commercial meaning and the action window available to an owner.
How do you calculate outbound reply rate?
Choose and disclose the denominator. A common operational definition is human replies divided by delivered outbound messages in the same cohort. State how bounces, automated responses, duplicates, suppression, and right-party delivery are treated. Then classify reply quality so the rate does not equate every response with buyer progress.
Should teams use industry benchmarks for outbound sales metrics?
Use external benchmarks as questions, not commands. Confirm the study's population, channel, role, denominator, time window, market, and method before comparison. Build an internal baseline with stable definitions first. If the cohorts are not comparable, preserve the external figure as context and do not turn it into a target.
How often should outbound metrics be reviewed?
Review according to action window and cohort maturity. Delivery and data failures may need monitoring during launch; replies and held meetings can support weekly diagnosis; accepted pipeline needs a mature handoff window; closed outcomes and revenue belong in longer strategic reviews. Never compare an immature cohort with one that has completed the sales cycle.